This page contains a dynamic scatterplot which will load new data as you proceed though the page. These updates will be announced in accordance to your screen reader's implementation of aria-region live.

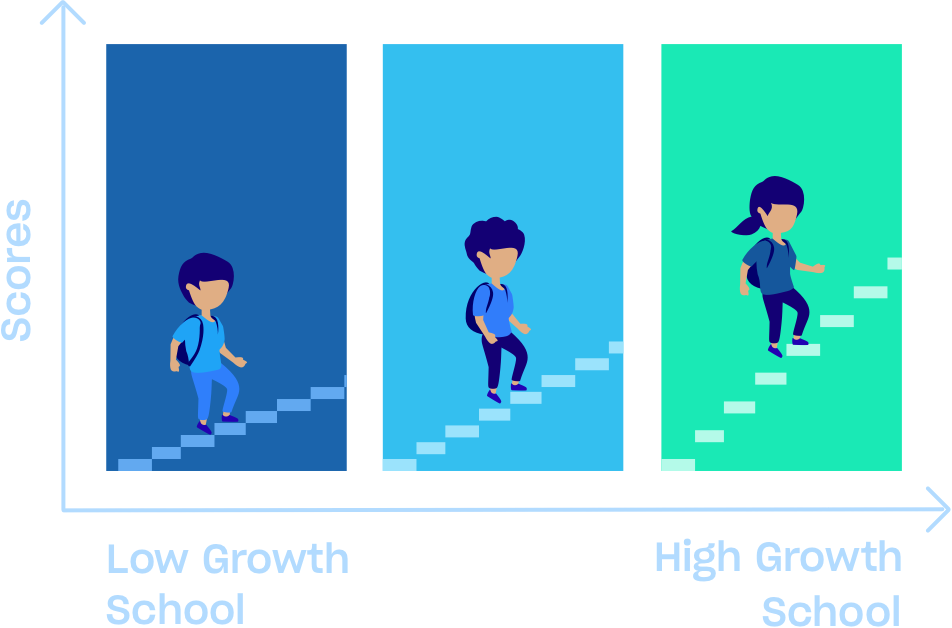
The learning rate indicates approximately how much students learn in each grade in a school, district, or county. Because most educational opportunities in grades 3–8 are provided by schools, the average learning rate largely reflects school quality.
Scatterplot title
Scatterplot subtitle
