This page contains a dynamic scatterplot which will load new data as you proceed though the page. These updates will be announced in accordance to your screen reader's implementation of aria-region live.
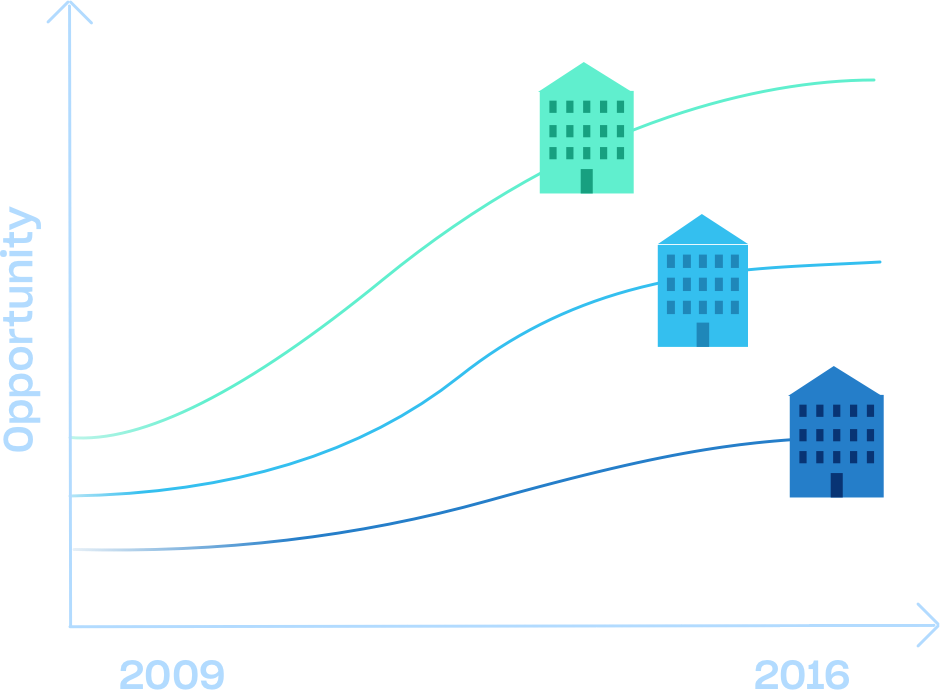
The trend in scores indicates how rapidly average test scores within a school, district, or county have changed over time. It reflects changes over time in the total set of educational opportunities (in and out of schools) available to children. For example, average scores might improve over time because the schools are improving and/or because more high-income families have moved into the community.