This page contains a dynamic scatterplot which will load new data as you proceed though the page. These updates will be announced in accordance to your screen reader's implementation of aria-region live.
Racial and ethnic disparities in children’s academic performance are a stubborn feature of the American educational landscape.
Though these gaps are substantially smaller than they were 40 years ago, they remain quite large: the difference in standardized test scores between White and Black students amounts to roughly two years of schooling. The gap between White and Hispanic students is almost as large.
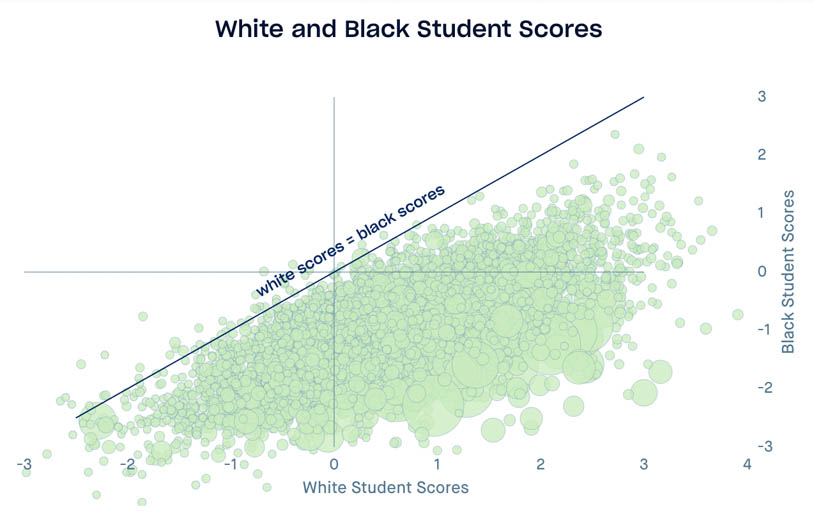
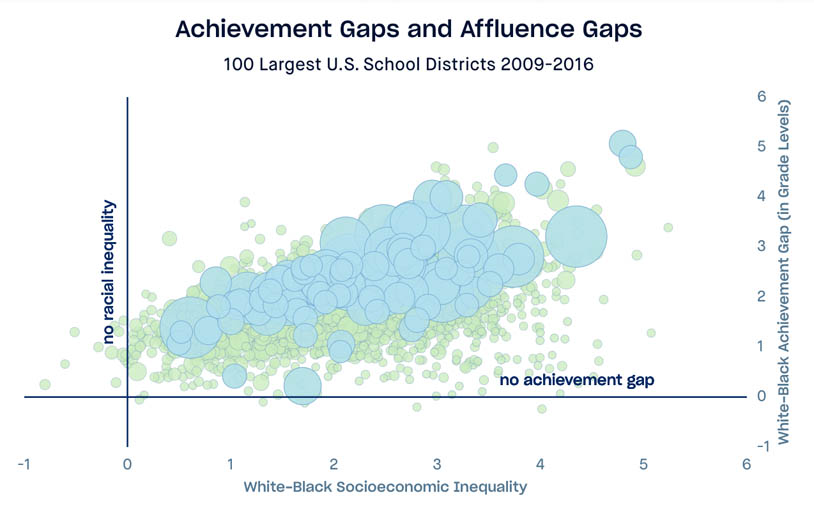
The first figure compares the average performance of Black and White students. Each circle is a school district, and the size of the circle is proportional to the number of Black and White children enrolled in the school district. Districts that lie on the diagonal line have no White/Black disparity in test scores, and the farther a district sits away from the diagonal line, the greater the gap in that district.

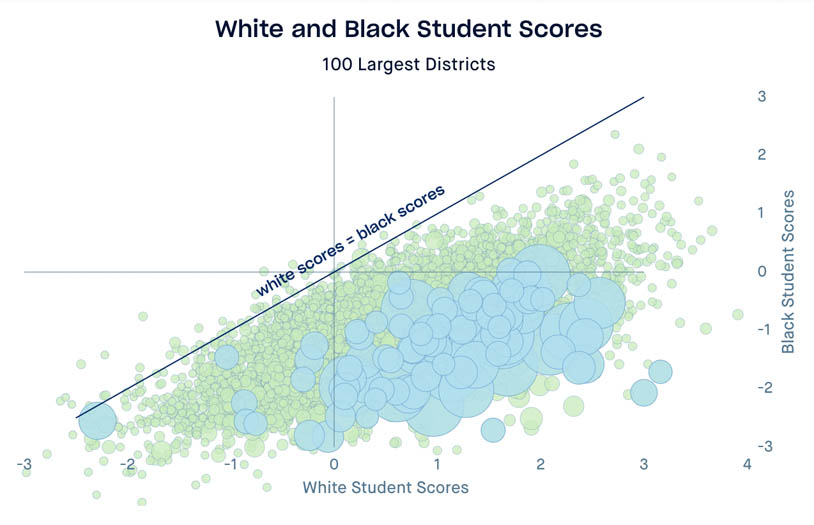
Consider the nation’s 100 largest school districts (collectively, these 100 districts serve over 2.5 million Black and 2.5 million White students). Almost all of these districts fall well below the diagonal line on the chart, indicating large achievement gaps. In almost all of these districts, Black students’ scores are below—generally far below—the national average. In contrast, in most of the districts, White students scores are above the national average. In fact, there is no large school district in the United States where Black students are both performing moderately well and are on par with White students.
It is common to assume that these gaps have a straightforward explanation: White students tend to live in wealthier communities, where schools often have more resources and are presumed to be better. The data, though, do not support this argument. In general, gaps in academic performance are quite large when children enter school in kindergarten, a pattern we can’t blame on schools. Moreover, the gaps grow relatively little while children are in school, which is not what we’d expect if schools were primarily responsible.
One reason schools are blamed is a common, but fundamental, error in interpreting test score data. Low average test scores do not mean that schools are at fault. (See our Discovery article, “Affluent Schools Are Not Always the Best Schools” to understand how school effectiveness can be measured.) Think about how students’ academic skills and capacities develop. A child’s early experiences—at home, in child care and preschool, in their neighborhoods, and with their peers—provide opportunities to develop socioemotional and academic capacities. Average test scores of students reflect all of these experiences, and so it is better to think of them as a measure of the total set of educational opportunities children have had. Gaps in average test scores, therefore, represent gaps in educational opportunity.
The figure makes clear that Black students have fewer educational opportunities than White students in almost every American school district. What, then, can we do to equalize educational opportunity?
This is where fine-grained data can be so helpful. There are some 13,000 public elementary school districts in the U.S. Are there communities where opportunity gaps are particularly small or large? Are there any communities that provide high levels of educational opportunity to White, Black, and Hispanic children alike? Are there places where the public schools appear to be a force for equity? What kinds of communities provide the most equal or unequal educational opportunities?
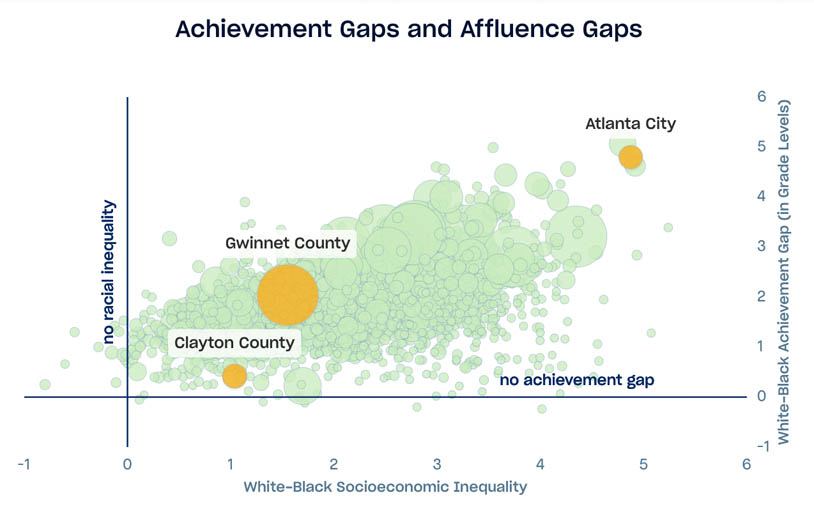
The data show enormous variation in the size of opportunity gaps. Consider 3 school districts in the Atlanta metropolitan area.
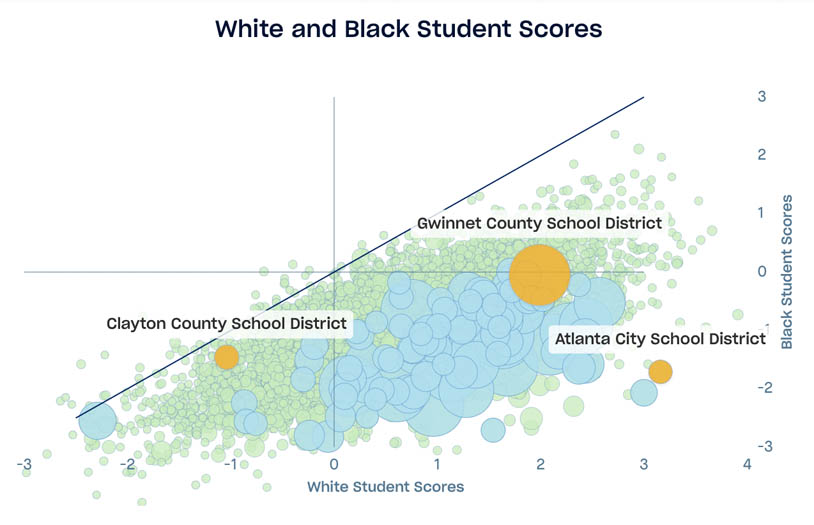
In Clayton Co., just south of Atlanta, the gap is small, but that’s because both White and Black students score well below average. Both groups experience quite low levels of educational opportunity.
Northeast of Atlanta, in Gwinett Co, the patterns are better in some ways—both White and Black students score higher than in Clayton Co. But the news is not all good: the White/Black gap is much larger here, about 2 grade levels. The high level of educational opportunity in Gwinett County are not equally available to its Black and White children.
And in Atlanta itself, opportunity is even more unequal. White students have very high levels of opportunity (and achievement), better even than White students in Gwinett. But Black students in Atlanta suffer from very low educational opportunities, and have test scores lower than Black students in Clayton. The achievement gap is almost 5 grade levels. Educational opportunity is more unequal in Atlanta than in almost any other community in the nation.
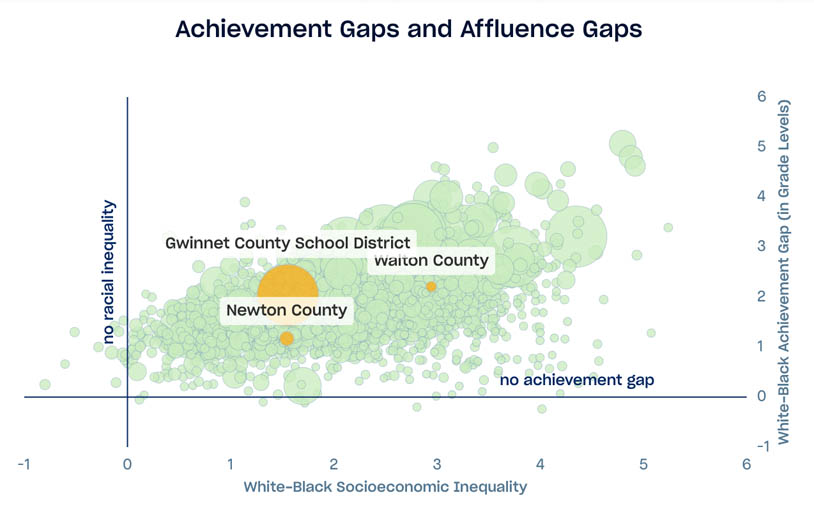
Why are the opportunity gaps larger in some districts than in others? One factor is racial differences in socioeconomic status. Parents with more money can provide more educational opportunities for their children. So, in communities where White parents have higher incomes and more education than Black parents, the opportunity gaps are larger.
So what other factors contribute to unequal opportunity? Our research suggests that the most important predictor of achievement gaps is school segregation. This is readily evident in the data.
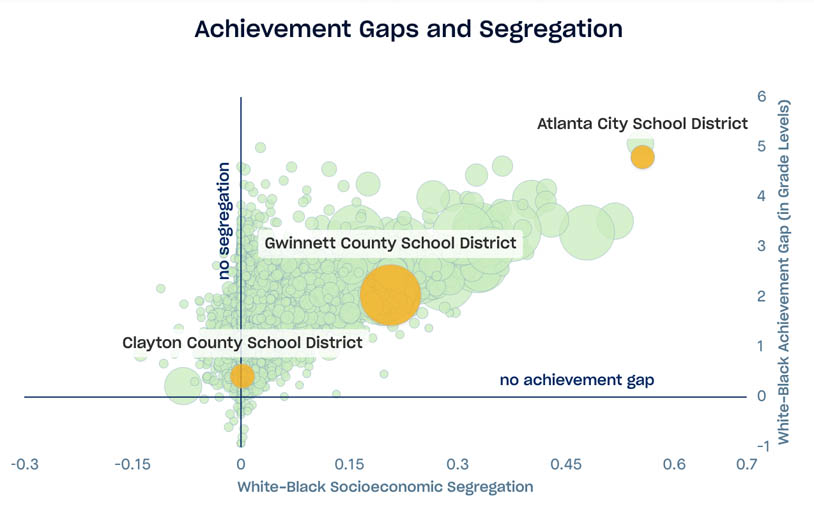
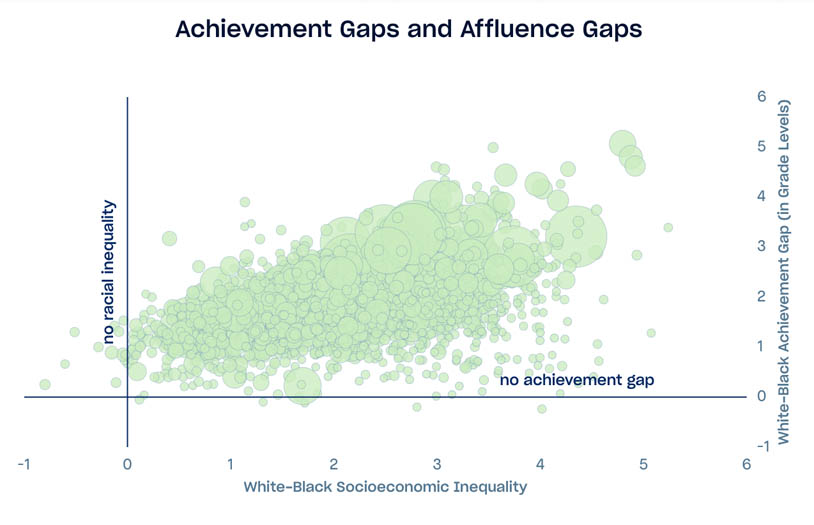
In this figure, the horizontal axis indicates the degree to which Black students are concentrated in different, higher-poverty, schools than White students in the same district. A value of 0 means that White and Black students attend schools with equal poverty rates. Districts located to the right in the figure are the most highly segregated, where Black students are concentrated in higher poverty schools and White students in lower poverty schools. The pattern is clear: more segregated districts generally have larger achievement gaps than less segregated ones. Atlanta is twice as segregated as Gwinnett County and has an achievement gap more than twice as large. Clayton County, where White and Black students are not segregated, has the smallest achievement gap.
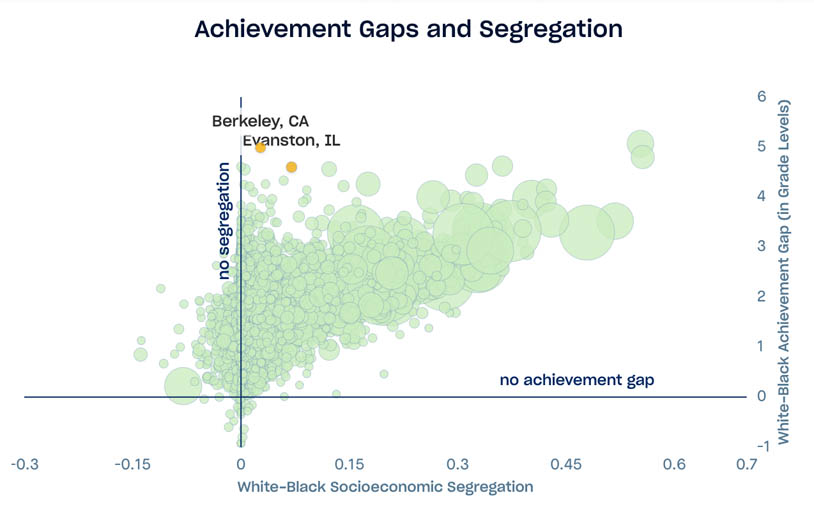
Moreover, among the several thousand school districts in the US with more than a handful of Black students, there is no moderately or highly segregated district with a small achievement gap. It is possible to have a large achievement gap in the absence of segregation (as in Berkeley, CA and Evanston, IL), but segregation appears to be tightly linked to inequality in educational opportunity. If it is possible to provide equal educational opportunity under conditions of segregation, no community in the U.S. has discovered the way. Racial segregation, which has limited the opportunities of Black children and families for generations, continues to limit them today.
Published September 2019 with SEDA 3.0 data.
Suggested Citation: Reardon, S. F. (2019). What explains White-Black differences in average test scores? [Data Discovery by The Educational Opportunity Project]. https://edopportunity.org/discoveries/white-black-differences-scores/