Glossary
Administrative District
leaid). We use term sedaadmin to refer to administrative school districts in our datasets. Note that this is distinct from the sedalea or geographic district used in SEDA 6.0 and prior versions.
Average Test Score
Learning Rate
Trend in Test Scores
Trend in Learning Rates
SES
Grade Level (2019)
Average
Standard Deviation
Standardized
Achievement Test
Test Score
Achievement Level (or Proficiency Level or Proficiency Category)
Cut Score/Threshold
Proficiency Data
Proficiency Rate
Linking
NAEP
EDFacts
The National Assessment of Educational Progress; see https://nces.ed.gov/nationsreportcard/about/ for more detail.
A database of school proficiency data from state accountability testing housed by the National Center for Education Statistics; see https://edfacts.ed.gov/ for more detail.
HETOP
ECD
FRPL
Understanding the Data
Where do the test score data come from? What years, grades, and subjects are used?
The data are based on the achievement tests in math and Reading Language Arts (RLA) administered annually by each state to all public-school students in grades 3–8 from spring 2009–2019 and from spring 2022-2025. We use the 2009-2019 data reported by EDFacts and the 2022-2025 data reported by the Education Data Center (EDC, see: www.zelma.ai) as the basis for the estimates shown in this explorer.
We combine information on the test scores in each unit with information from the National Assessment of Educational Progress (NAEP; see https://nces.ed.gov/nationsreportcard/about/) to compare scores from state tests on a common national scale (see the Methods page).
We never see nor use individual test scores in this process. The raw data we receive include only counts of students scoring at different test-score levels, not individual test scores. There is no individual or individually-identifiable information included in the raw or public data.
What are “educational opportunities”?
Why are there four different summaries of test scores (average scores, trends in scores, learning rates, and trends in learning rates) in each place? What can we learn from each of these?
The four scores tell different stories.
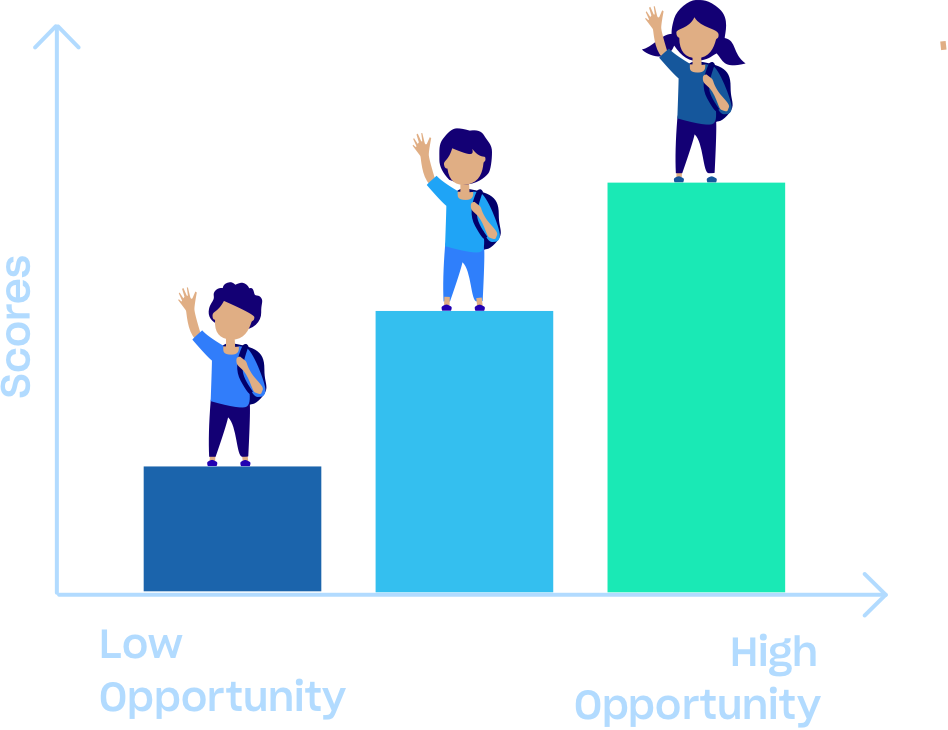
- Average test score: The average test score indicates how well the average student in a school, district, or state performs on standardized tests. Importantly, many factors—both early in life and when children are in school—affect test performance. As a result, the average test scores in a school, district, or state reflect the total set of educational opportunities children have had from birth through middle school, including opportunities at home, in child-care and preschool programs, and among peers. Average test scores therefore reflect a mix of school quality and out-of-school educational opportunities.
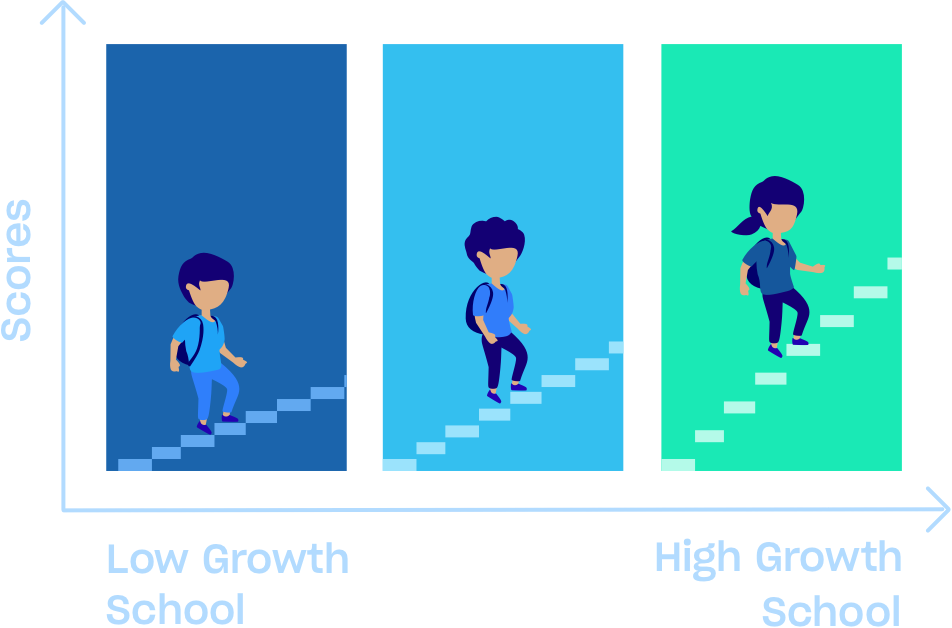
- Learning rate: The learning rate indicates approximately how much students learn in each grade in a school, district, or state. Because most educational opportunities in grades 3–8 are provided by schools, the average learning rate largely reflects school quality.
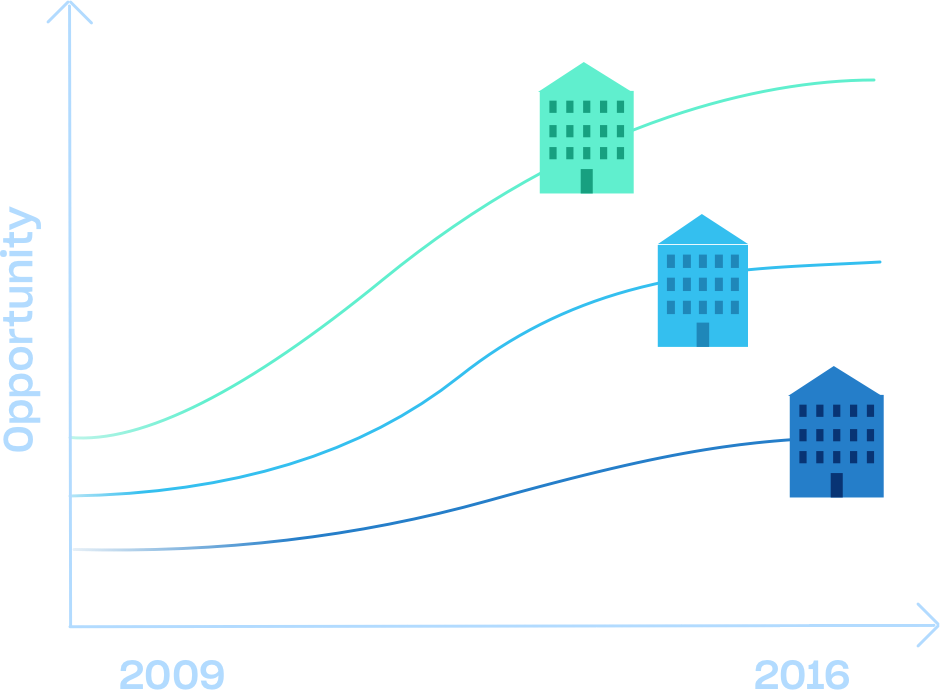
- Trend in test scores: The trend in scores indicates how rapidly average test scores within a school, district, or state have changed over time. It reflects changes over time in the total set of educational opportunities (in and out of schools) available to children. For example, average scores might improve over time because the schools are improving and/or because more high-income families have moved into the community.
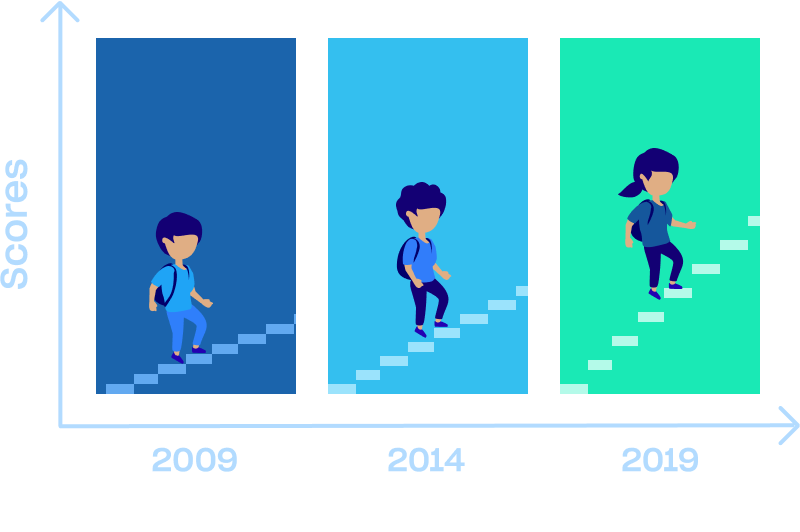
- Trend in learning rates: Trends in learning rates measure how much annual learning rates change over time. These are a better indicator of changes in school quality than trends in average test scores, which are influenced by a range of experiences outside of school.
For more information on how the average test score, trend in average test scores, learning rate, and trend in learning rates are computed, see the Methods page.
How is socioeconomic status measured?
For each geographic district or county, we use data from the Census Bureau’s American Community Survey (ACS) to create estimates of the average socioeconomic status (SES) of families. Every year, the ACS surveys families in each community in the U.S. We use six community characteristics reported in surveys from 2020-2024 to construct a composite measure of SES in each community:
- Median income
- Percentage of adults age 25 and older with a bachelor’s degree or higher
- Poverty rate among households with children age 5–17
- Percentage of households receiving benefits from the Supplemental Nutrition Assistance Program (SNAP)
- Percentage of households headed by single mothers
- Employment rate for adults age 25–64
The composite SES measure is standardized so that a value of 0 represents the SES of the average school district in the U.S. Approximately two-thirds of districts have SES values between -1 and +1, and approximately 95% have SES values between -2 and +2 (so values larger than 2 or smaller than -2 represent communities with very high or very low average socioeconomic status, respectively). In some places we cannot calculate a reliable measure of socioeconomic status, because the ACS samples are too small; in these cases, no value for SES is reported. For more detailed information, please see the technical documentation available on the Get the Data page.
Why is my district not on the map or in the data?
There are several reasons why we may not show data for a particular state or district.
Estimates for all districts in a state are missing when sufficient data for estimation were not reported by the state in 2022-2025. Insufficient data may result from lack of reporting, low state-wide participation, or changes to the state test.
Estimates for an individual district may be missing because:
- Sufficient data for estimation were not reported for the district. Public data is often suppressed by the state to protect student privacy. When there is substantial suppression for an individual district, we may not be able to use the data to construct estimates.
- The district is too small and/or has too few grades of data available to allow for the construction of reliable estimates.
- The district does not have a geographic boundary; such districts include charter districts and/or specialized local education agencies.
- Fewer than 94% of students in the district participated in testing in the subject.
For more details, see the technical documentation available on the Get the Data page.
Using the Opportunity Explorer
What are the different ways of exploring the data?
What do the colors in the map and charts mean?
Light gray represents zero, or “no change” in average test scores.
Positive changes in average test scores are shown in green and negative changes in blue. Darker shaded circles represent larger changes.
Colorblind users: We have made efforts to ensure accessibility for the most common forms of colorblindness. For less common forms (such as tritanopia), colors may be less distinguishable; however, the data are still accessible in the map legend, charts, and other displays.
What kinds of locations can I view?
How can I find a location and view its data?
You can navigate to your desired location via the navigation controls in the map. Or type a location name into the search bar in the header.
Hovering (or on a touch device, tapping) on a location in the map or chart will show an overview of that location’s data. Clicking or tapping on the location will open a Location Panel that shows a full view of all available data, as well as options for viewing other selected locations.
Clicking or tapping on locations will also add them to the Locations menu within the left-side Data Options panel. (You can add an unlimited number of locations.) Click or tap on any location’s tab to highlight it in the map or chart, and the Locations menu.
How many locations can I select at once?
How do I see all the data for a location at once?
How can I filter the data?
In the Data Options column displayed on the left, click Data Filters. Using the controls in this panel, you can filter what data is displayed on the map.
When multiple selections are made, the filters work together to narrow what is displayed. To return to the default view, click the “Reset data filters” button. If a filter is not available, you will not be able to select it.