Two Watches: Measurement Error Models for Estimating Educational Progress from Discrepant Test Score Trends
From Learning Recession to Learning Recovery: Understanding the Sources of U.S. K-12 Improvement
Determinants of Between-School Variation in Student Achievement: Results from US Population Data
Pivoting from Pandemic Recovery to Long-Term Reform: A District-Level Analysis

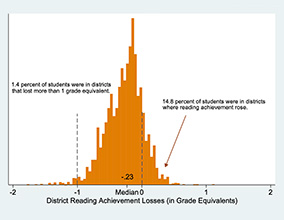
The First Year of Pandemic Recovery: A District-Level Analysis
The distribution of child physicians and early academic achievement
Has the Opioid Crisis Affected Student Learning? A National Analysis of Growth Rates
School District and Community Factors Associated With Learning Loss During the COVID-19 Pandemic
Uneven Progress: Recent Trends in Academic Performance Among U.S. School Districts
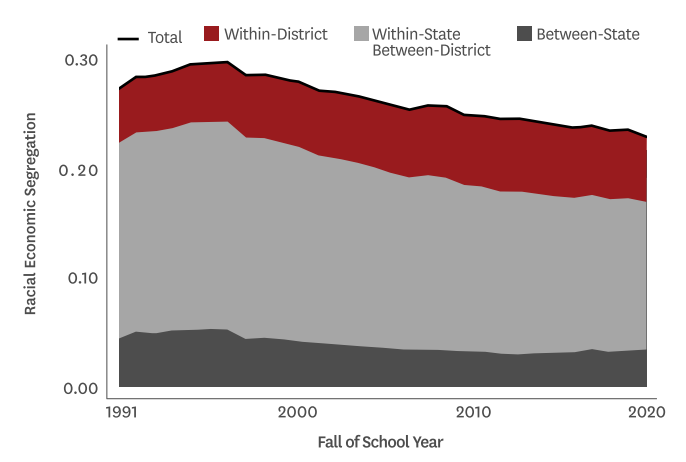
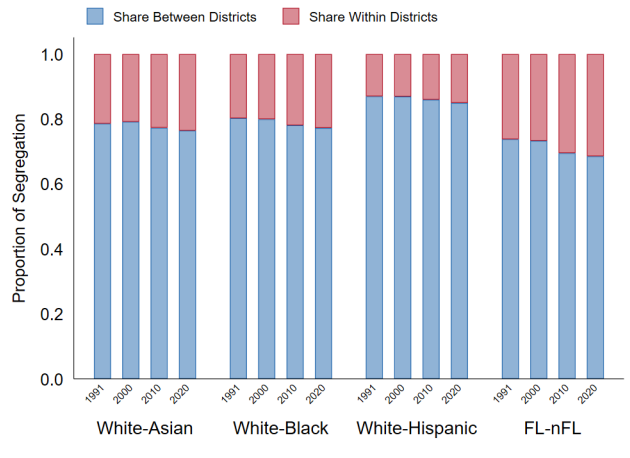
Trends in Racial Economic Segregation and Its Geographic Decomposition, 1991–2020
Racial Economic Segregation among U.S. Public Schools, 1991-2020
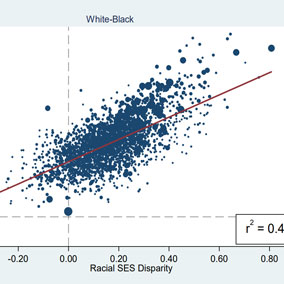
Is Separate Still Unequal? New Evidence on School Segregation and Racial Academic Achievement Gaps
Trends in Racial/Ethnic and Economic School Segregation, 1991–2020
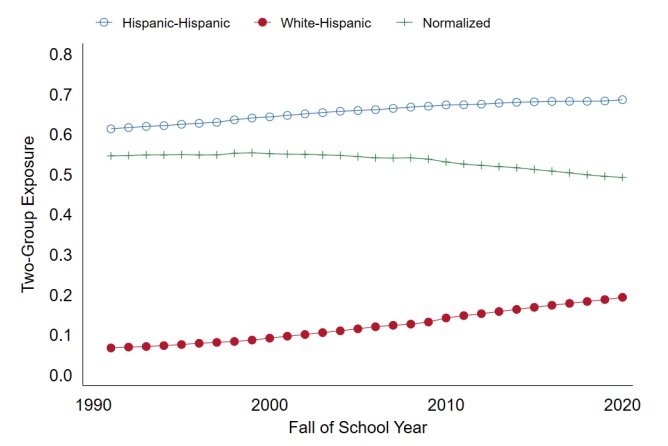
Measuring Segregation With the Normalized Exposure Index
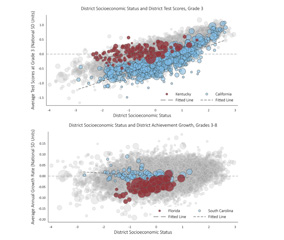
States as Sites of Educational (In)Equality: State Contexts and the Socioeconomic Achievement Gradient
Gender Achievement Gaps in U.S. School Districts
Educational Opportunity in Early and Middle Childhood: Using Full Population Administrative Data to Study Variation by Place and Age
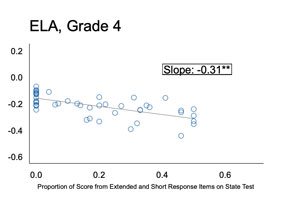
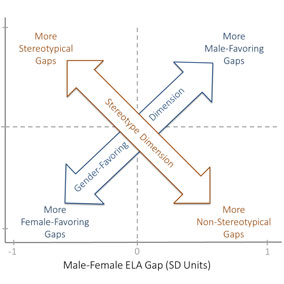
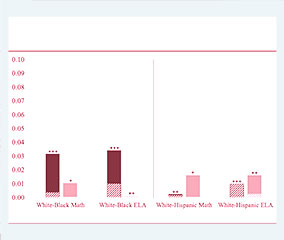
The Relationship Between Test Item Format and Gender Achievement Gaps on Math and ELA Tests in 4th and 8th Grade
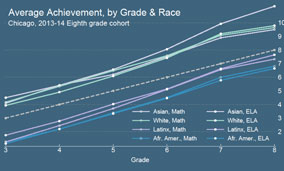
Test Score Growth Among Chicago Public School Students, 2009-2014
How much do test scores vary among school districts? New estimates using population data, 2009-2015
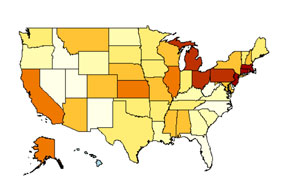
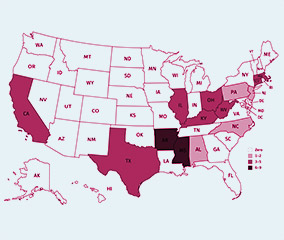
States of Segregation: Ranking the states on racial and economic segregation in public schools
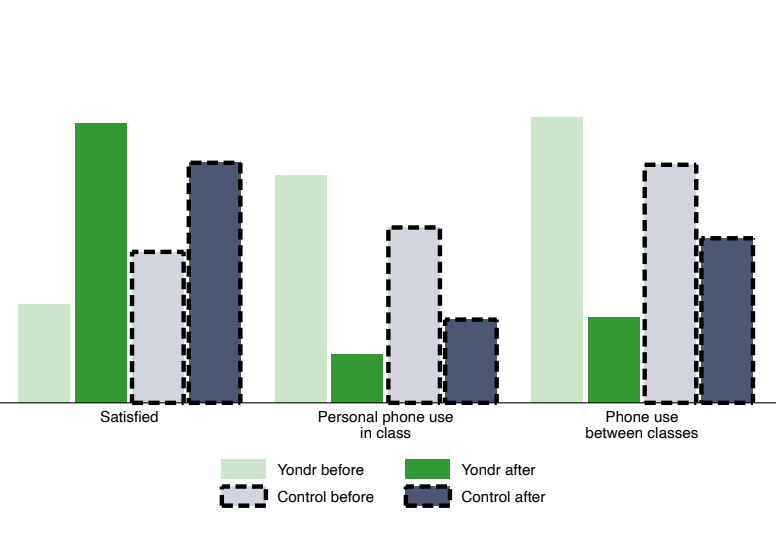
The Effects of School Phone Bans: National Evidence from Lockable Pouches
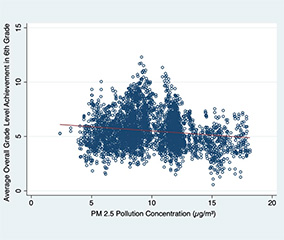
Particulates Matter: The Influence of Cumulative Local Air Pollution Exposure on Sixth-Grade Academic Achievement in California
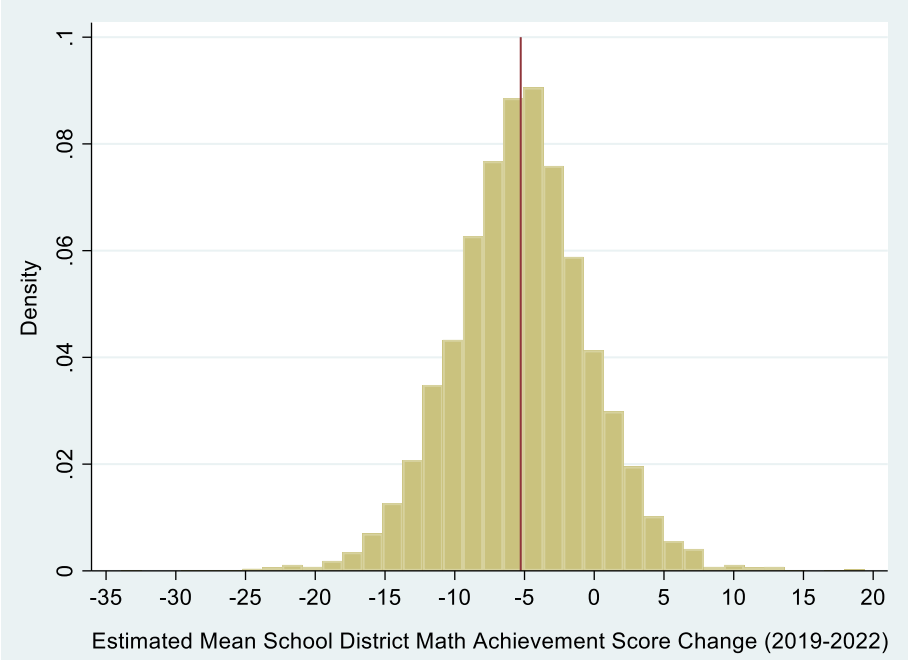
Educational Rights and Wrongs: How COVID-Related Student Math Achievement Losses Distributed and Implications for Equal Educational Opportunity

Differences in educational opportunity predict white matter development
Why Did So Many Public Schools Stay Remote During the COVID Crisis?
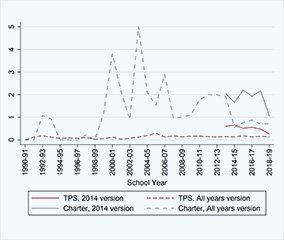
Extreme Measures: A National Descriptive Analysis of Closure and Restructuring of Traditional Public, Charter, and Private Schools
District-Level School Choice and Racial/Ethnic Test Score Gaps
How Do Charter Schools Affect System-Level Test Scores and Graduation Rates? A National Analysis
Evaluating Education Governance: Does State Takeover of School Districts Affect Student Achievement?
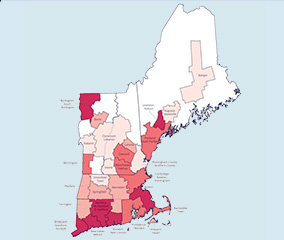
Racial and Socioeconomic Test-Score Gaps in New England Metropolitan Areas: State School Aid and Poverty Segregation
Parents’ Online School Reviews Reflect Several Racial and Socioeconomic Disparities in K–12 Education
Identifying Progress Toward Ethnoracial Achievement Equity across U.S. School Districts: A New Approach
The Reversal of Mount Laurel’s Regional Contribution Agreements and the Impact on White-Black Academic Achievement Gaps Across New Jersey: 2008–2014
Effects of Four-Day School Weeks on School Finance and Achievement: Evidence from Oklahoma
Status, Growth, and Perceptions of School Quality
The opioid crisis and community-level spillovers onto children’s education
Personal Belief Exemptions for School Entry Vaccinations, Vaccination Rates, and Academic Achievement
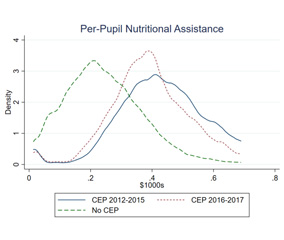
Universal Access to Free School Meals and Student Achievement: Evidence from the Community Eligibility Provision
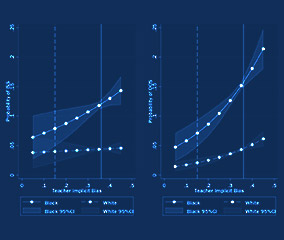
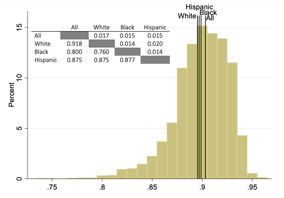
Bias in the Air: A Nationwide Exploration of Teachers' Implicit Racial Attitudes, Aggregate Bias, and Student Outcomes
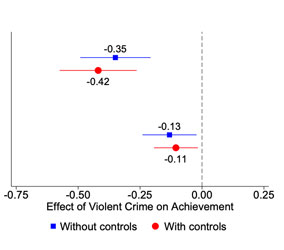
Crime and Inequality in Academic Achievement Across School Districts in the United States
County-Level Rates of Implicit Bias Predict Black-White Test Score Gaps in U.S. Schools
Are Achievement Gaps Related to Discipline Gaps? Evidence From National Data
The Effects of Student Growth Data on School District Choice: Evidence from a Survey Experiment
Immigration Enforcement and Student Achievement in the Wake of Secure Communities
SEDA 2022 Special Release Technical Documentation
Using Pooled Heteroskedastic Ordered Probit Models to Improve Small-Sample Estimates of Latent Test Score Distributions
Can Repeated Aggregate Cross-Sectional Data Be Used to Measure Average Student Learning Rates? A Validation Study of Learning Rate Measures in the Stanford Education Data Archive
Stanford Education Data Archive Technical Documentation
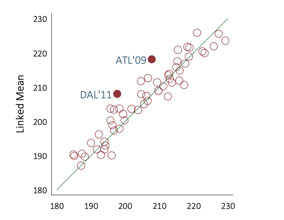
Validation methods for aggregate-level test scale linking: A case study mapping school district test score distributions to a common scale
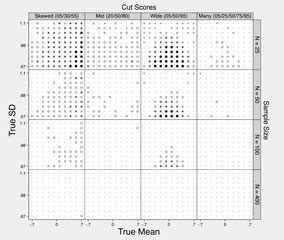
Using Heteroskedastic Ordered Probit Models to Recover Moments of Continuous Test Score Distributions from Coarsened Data
Practical Issues in Estimating Achievement Gaps from Coarsened Data

Estimating Achievement Gaps from Test Scores Reported in Ordinal "Proficiency" Categories
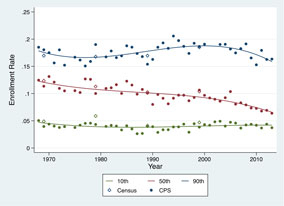
Long-Term Trends in Private School Enrollments by Family Income
Income Segregation between Schools and School Districts
60 Years After Brown: Trends and Consequences of School Segregation
Brown Fades: The End of Court-Ordered School Desegregation and the Resegregation of American Public Schools
Response to RFP on School-Level Academic Growth Indicators